|
My research lies broadly in the area of computer systems and architecture with
an emphasis on architectural and real-system techniques for power-efficient
computing systems. My research interests span computer architecture
and its interaction with systems software; architectural and real-system
techniques for power-efficient, reliable and secure computing systems;
hardware performance monitoring; microprocessor power/thermal modeling
and real measurement techniques; phase analysis; live, runtime monitoring
and prediction of workload phase behavior and phase-driven power
and thermal management. I am recently becoming also interested in
managing virtual machines. For my future research interests, check
out the future tab on the left or follow this future
research interests link. I finally got the time to go through
a major revision I was hoping to do for a while, I decided this
time to have everything in a single page, so it ended up being quite
long. Follow this link for my shorter
version of research summary.
In my PhD research at Princeton with my great advisor, Professor
Margaret Martonosi, and my industry collaborations with some
of the great researchers at IBM and Intel during my internships
and co-op stay at IBM, I have worked on accurate runtime characterizations
of dynamically varying workload power/performance/thermal behavior.
I have developed novel methods for detecting recurrent phase behavior
of applications under real-system variability and for predicting
application behavior at future execution, at different operating
modes of a chip multiprocessor and across different physical platforms
in a data center. I have investigated the effective application
of these predictive strategies to adaptive power management in multiprocessor
architectures (Global Power management in Chip Multiprocessors),
running systems (Dynamic Power Management Guided by Global Phase
History Table Predictictor) and data centers (Energy-Efficient Resource
Allocation in Heterogeneous Data Centers), combining architectural
and real-system techniques to address the power management problem
in a wide range of computing systems. One of the primary governing
themes in our research is the emphasis we put on bringing real-system
experimentation into architecture research and relying
on validations with real measurements wherever
possible. While this means a whole lot of development from time
to time (the recent running joke we had in the lab is what the heck
is a "journal commit I/O error" that I had for quite a
bit in one of our recent experiments:)), I think the end results
are usually a lot more fun than just having some numbers out of
a simulator when you actually see your research at work on a real
machine. For example observing the actual power consumed by the
processor at runtime or the successful phase detections/predictions
performed by your runtime detection/prediction framework. If you
feel a tiny bit interested in any of our projects and want to try
them out, I try to have all our developed framewokrs available,
but time does not permit to prepare detailed tutorials etc. for
all. So if you are interested in something and cannot find the corresponding
tools, let us know, and we'll send you the tools and some help in
building your experiments as you need. Below are some brief? intros
to different aspects of our work. I group them under three categories,
and will cite the papers/patents that go with them as appropriate:
- Performance Monitoring, Power/Thermal Modeling
and Measurement of Microprocessors on Real Systems [2002-2003]
- Phase Analysis, Live, Runtime Phase Characterization,
Detection and Prediction[2003-2006]
- Workload/Phase Adaptive Dynamic Power Management[2004-2007]
I see our work summarized partly with this below somewhat-flowchart:
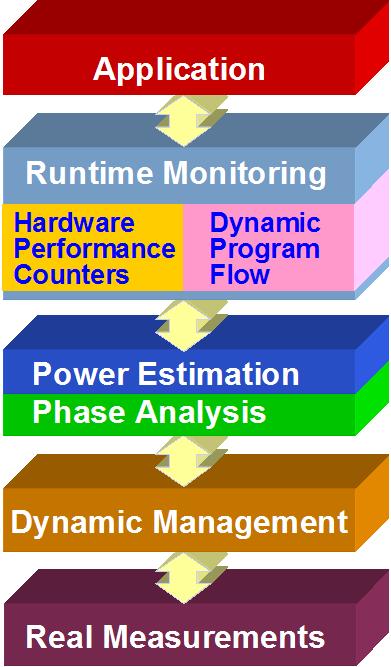 |
We monitor application execution at runtime via specific
features, such as certain performance metrics or dynamic control-flow
information (i.e. traversed basic blocks).
We use these tracked features to estimate processor power/thermal
behavior at runtime or to perform workload phase analysis.
The phase analysis generally involves multiple objectives,
such as: phase classification, detection and phase prediction.
These phase analyses and predictive power/performance models
are used to guide different dynamic management strategies.
Most of our work is performed on real systems and validated
with real measurements, with current probes/DMMs/DAQs.
|
1. Performance
Monitoring, Power/Thermal Modeling and Measurement of Microprocessors
on Real Systems [2002-2003]
To characterize application power and thermal behavior on real
systems, first we have looked into methods to model detailed, architecture-level
power dissipations and thermal characteristics on complex, out of
order processors.
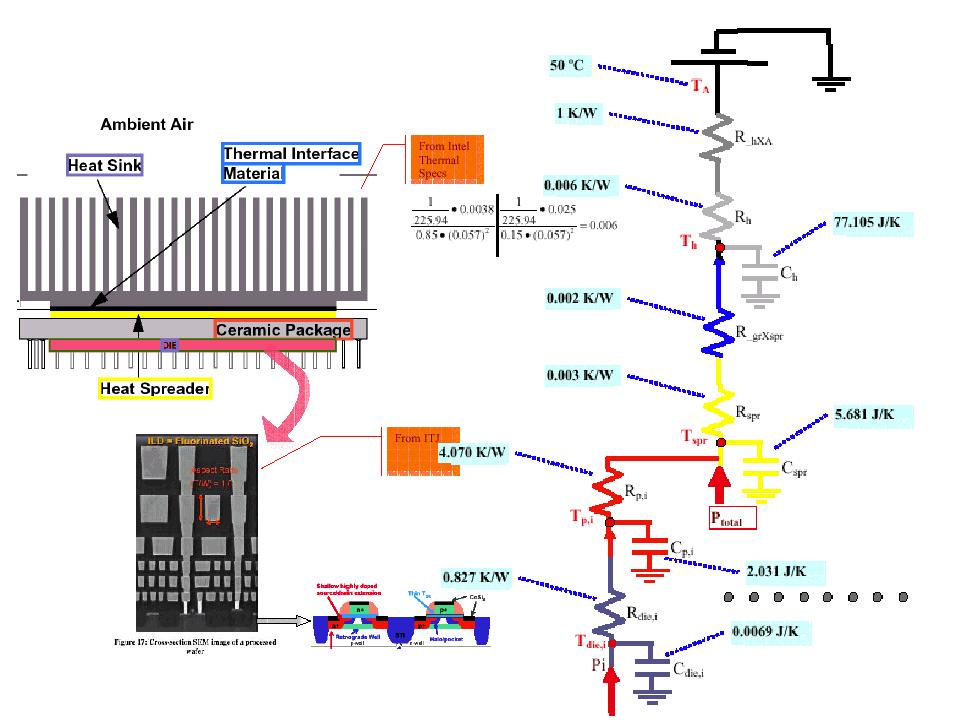
- Runtime Processor Thermal Modeling
on Real Systems: I have developed a thermal model
for a Pentium Pro processor based on Professor Russ
Joseph's power modeling project CASTLE.
The thermal model runs on the client side of CASTLE not to disrupt
the machine under test. It is based on a 4-degree Cauer
R-C model we devised for Ppro (Would probably extend
to several P6 implementations easily, as long as packaging materials
tend to be same/similar property). We consider constant ambient
~50C, from Intel Thermal design guidelines, and compute conduction
(Fourier's Conduction) and convection (Newton's
Cooling) to heatsink. We asssume constant airflow for convection
coefficient h. We consider heat spreader spreads
heat uniformly, so spreader and heatsink have uniform
temperatures. Package and die have varying temperature
though. The thermal model uses CASTLE generated component
power estimates for heat flow and computes temperatures
in all 4 levels with respect to the corresponding difference
equations. It is a separate autonomous thread that updates
with finer timescales than the CASTLE power model.I also worked
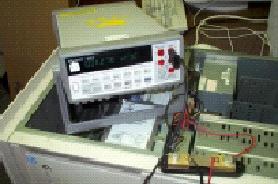
on a detailed real time P4 thermal model. Below are the snapshots
of Russ's experimental setup and the developed power monitoring
framework, my Pentium Pro thermal model and corresponding physical
structure (P4 is quite different with different materials and
flip-chip) and finally an example snapshot of the runtime thermal
modeling results together with the Castle power monitor. [2002]
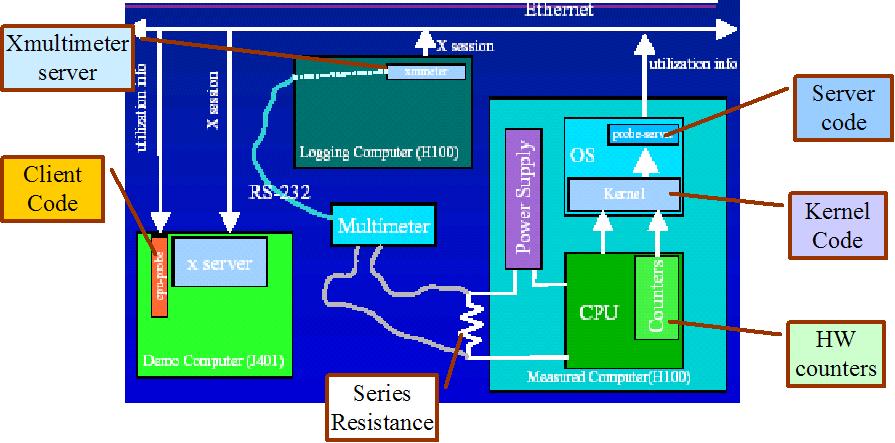
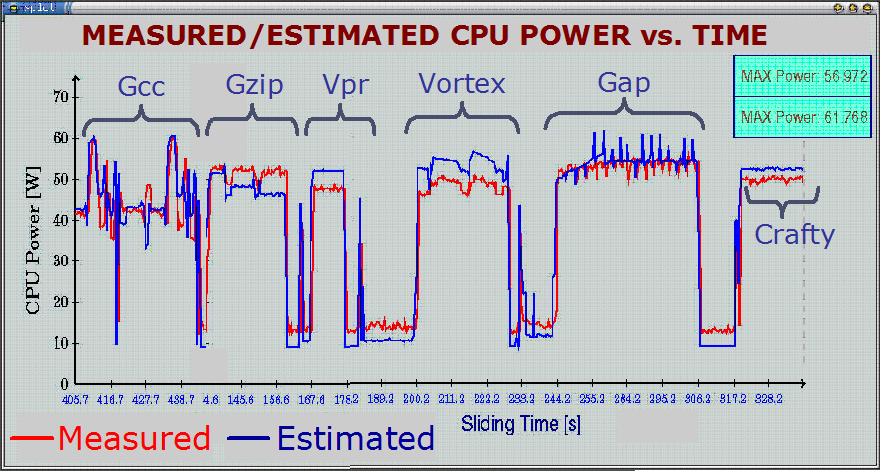
- Live, Runtime Power Monitoring
and Estimation on High-End Processors: I have
(FINALLY) developed a complete framework that models 22 physical
component powers for a P4 (Willamette) processor using performance
counter data collected at runtime with the help of Performance
Reader and that measures real time processor power for verification.
The Power Server side of the project
does the raw counter information collection and sends over ethernet
to Power Client, which performs component
power estimation. Real power measurement branch collects processor
power consumption info via the current probe and plugs to DMM
that connects to Power Client via RS232. Power Client also generates
the runtime Total Power Monitor that
synchronously plots measured total power and our estimation real
nicely, over a sliding time window of 100s; and runtime Component
Power Breakdown Monitor that plots the component
powers as bargraphs at each sample point, with the numerical values
floating on top. With this framework and our access heuristics
and empirical power estimations, we can quite accurately estimate
unit-wise and total processor power consumption for arbitrarily
long application runtimes. As an implementation sidenote, this
is pretty much how I had imagined this, I also wanted to have:
"click on any component bar and its power vs time trace pops
up and starts also plotting this" feature, which would be
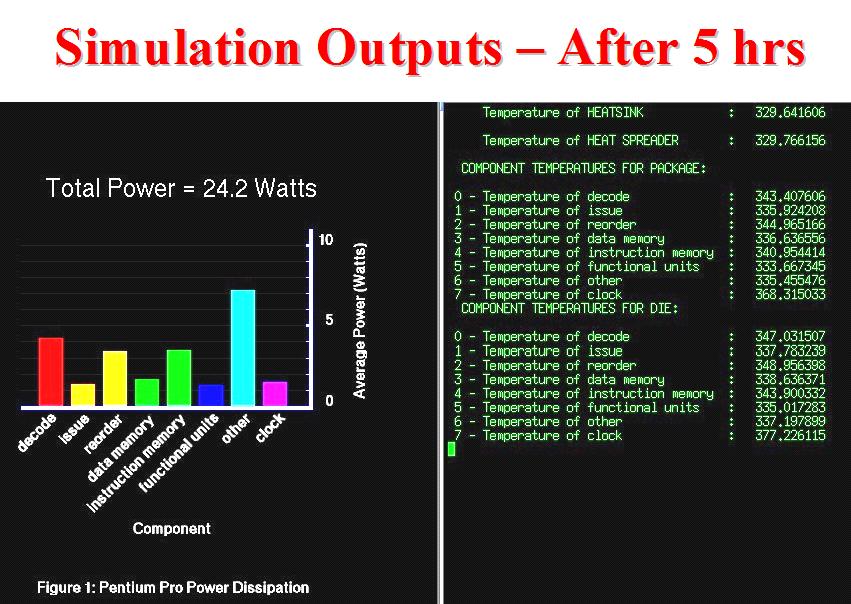
amazing, but I don't have the know-how or time for that now. Below
are some snapshots from (1) the experimental setup, with the test
macine and the current probe on left upper corner, client machine
in the middle and the two runtime monitors on lower right; (2)
the event counter based power estimation model; (3) actual timeslices
from the two monitors (These are real measurements/estimations
while the machine is running, which I had translated to pseudo-gif;)
at runtime in the power client) (4) an example set of results
for our power estimations. [2003][MICRO-36]


2. Phase
Analysis, Live, Runtime Phase Characterization, Detection and Prediction
[2003-2006]
One of the primary drivers of improving computing power efficiency
is the inherent variability in both the running workload demands
and the underlying computing structures. Efficiently matching the
underlying resources to the dynamically varying application demands
by adaptively configuring or allocating these computing structures
is a powerful enabler for power-efficient computation. In this line
of our research, we investigated how we can develop accurate and
practical characterizations of dynamically varying workload demands
and correctly project future application behavior. Specifically,
we introduced new real-system methods to identify and predict repetitive
patterns in application execution, which are commonly referred to
as phases, under real-system variability
effects.Overall, this thrust of our research shows a complete roadmap
to effective on-the-fly phase detection and prediction on real-systems
and lays the ground work for their application to workload-adaptive
dynamic management techniques.
- Workload Phase Behavior:
Before going into the details of our work in this area, let me
first clarify what we mean by application phases. Phases
are distinct execution regions of an application that also generally
exhibit some level of repetitive behavior due to the
procedure and loop-oriented dynamic execution characteristics.
Below chart shows an example of phase behavior with a snapshot
from SPEC CPU2000 Vortex execution. Top two plots show the measured--via
performance counters--performance behavior in terms of IPC and
memory access rates. Here we see very distinct and highly repetitive
execution characteristics, which I highlight into two major phases.
The lower plot also shows the measured--via a current probe--power
consumption of the processor for the same execution region. Interestingly,
power also reflects the phase behavior of Vortex. There are other
interesting examples to phase behavior from other researchers,
for example see Brad Calder and Tim Sherwood's SimPoint
project and Uli Kremer and Chungling Hsu's publications.

The goals of our work are to characterize this phase behavior,
with a focus on power, detect the repetitive behavior under system
variability and predict future phases.
- Phase Characterization for Power:
We have explored methods to identify dynamically varying power
demand, or “power phases”
of workloads. Our analyses showed we can extract significant power
behavior information from component power data and can identify
power phases in application traces, within arbitrarily long timescales.
Interpreting our derived microarchitecture-level power estimations
as characteristic vectors of varying application power behavior,
we have shown that similarity analysis methods applied to these
characteristic vectors help expose power phase behavior of applications.
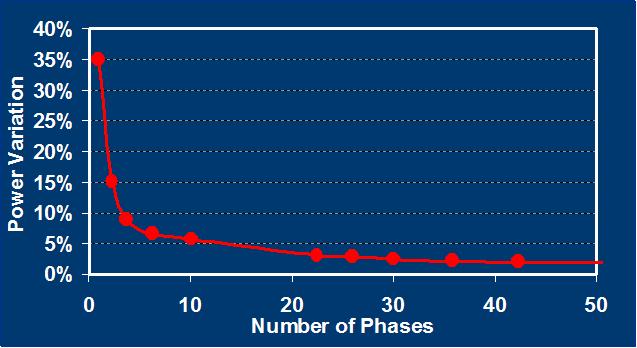
With this methodology, a small set of (10-20) derived "representative
power signatures" characterize overall application
power behavior with reasonable accuracy (capturing application
power variation within 5% errors).
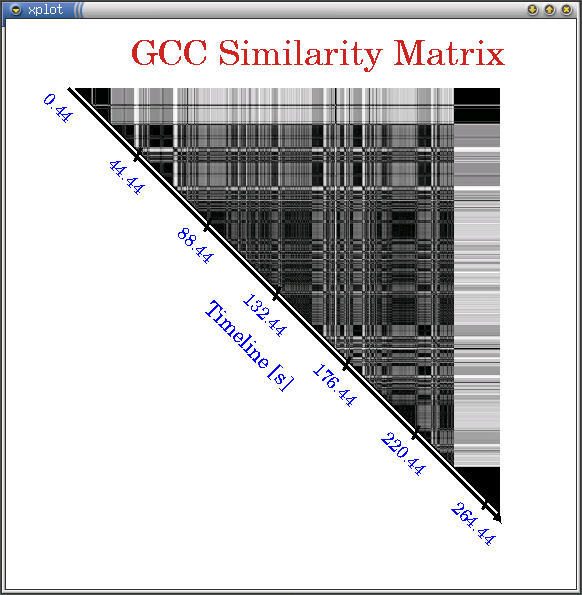
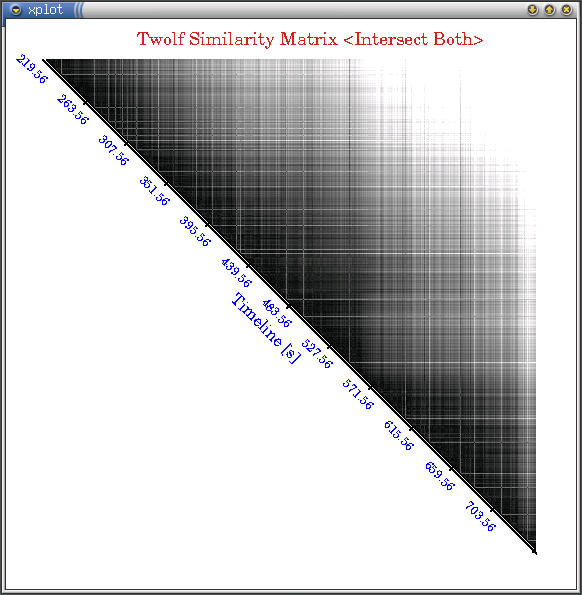
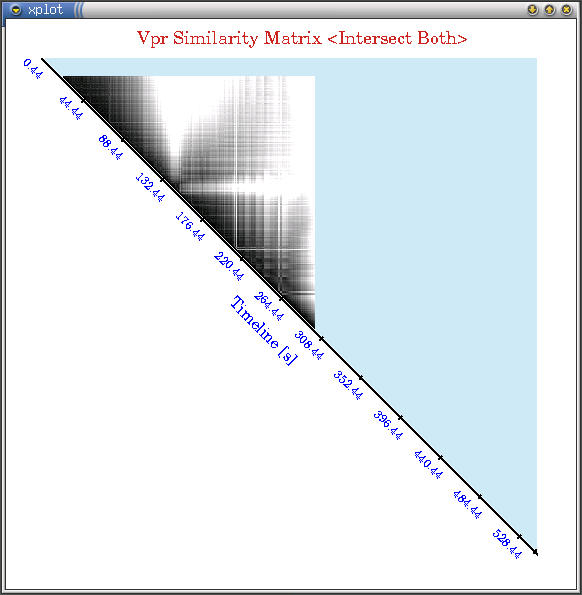
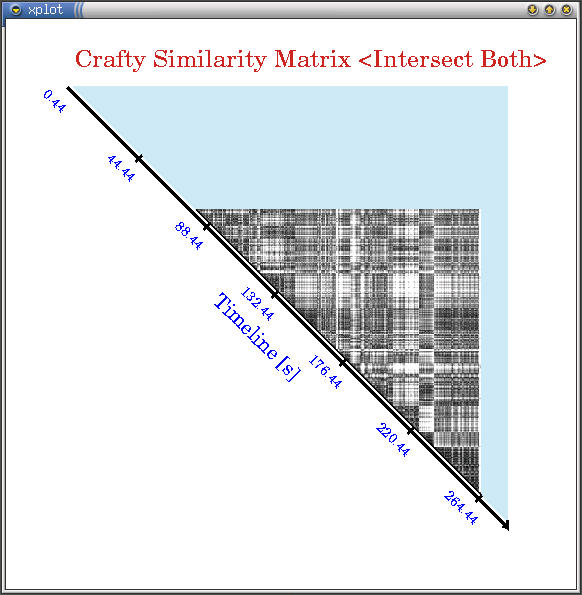
We have devised similarity matrices similar to Brad Calder's
phase work based on our component power data, which we name
Power Vectors, and demonstrated phase information
with Matrix Plots. Then we developed
a similarity metric based on a composition of absolute and normalized
Manhattan Distance (L1 Norm) between power vectors, which we
found more suitable for power behavior similarity. We used a
thresholding algorithm to group application's execution points
into phases and demonstrated the groups with Grouping
Matrices. Afterwards, we have seen that we can
represent the overall program power behavior with a small set
of signature vectors.
There are many interesting aspects to this work that we can still
expand upon in time, such as the mapping of timing information
to other architectures to be able to power simulate, PC sampler
LKM for using control-flow information in cooperation, other interesting
classifications based on PCA, ICA, SVD, mutual information, etc.
Below are some snapshots of the interesting similarity matrix
plots (darker regions are more similar) we have seen for some
SPEC applications (click on images for larger versions). All applications
show very different similarity behavior in terms of granularities
and temporal repetitions. Afterwards I show a very distilled plot
of how characterizing execution into different power phases captures
most of power variations in applications. [2003][WWC'03]
- Comparing Event-Counter-Based
and Control-Flow-Based Phase Characterizations:
We have also looked at how different representations of application
behavior such as our performance features and dynamic execution
information (i.e. control flow) perform for accurate phase characterizations.
We developed a novel evaluation framework using a combination
of dynamic instrumentation with performance monitoring and real
power measurements. This experimental setup took a lot of effort
to build, but I was very happy with it at the end. We used Intel's
Pin tool for dynamic instrumentation, and I think this is
a great tool to use for architectural real experimentations. Our
evaluations revealed that explored diverse application features,
such as performance monitoring counter (PMC) events and programmatical
control-flow deliver significant insights to application power
behavior. Moreover, our proposed phase characterization strategy
based on characteristic vectors consistently provided a more accurate
description of power characteristics, with 40% improvements over
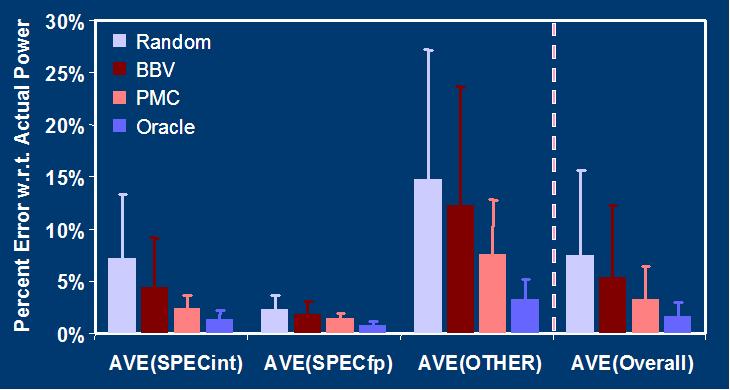
control-flow-based approaches for a large pool workloads. Below
first is a high level view of the experimental setup. The actual
machine we used is a P4 similar to the one I had shown above.
Next an interesting example to how both approaches perform different
phase characterizations with the Mesh
benchmark. Last is the general set of results showing the
characterization errors for PMC-based and control-flow-based (BBV)
approaches in comparison with Oracle and random classifications.[2005][HPCA-12]

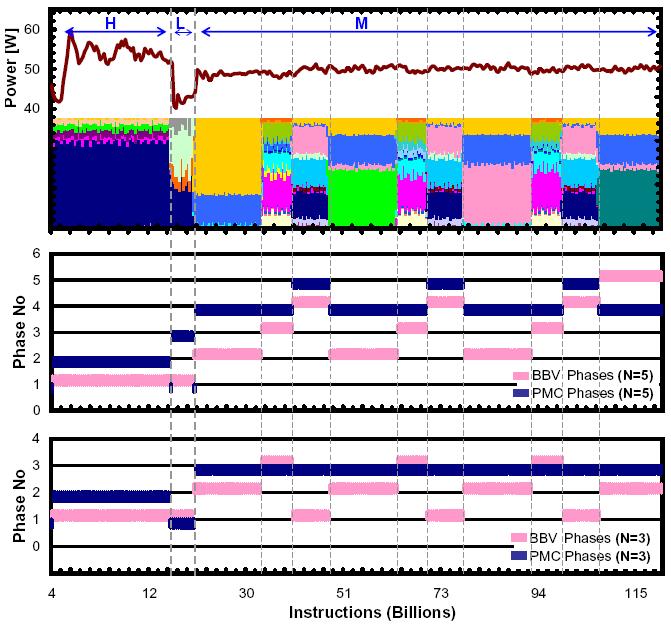
Mesh
power and BBV signatures (top) and generated PMC and BBV phases
with target cluster numbers of 5 (middle) and 3 (bottom). Multiple
control flow phases with effectively same power characteristics
disguise actual power phases in BBV based classification. Actual
power phases are labeled as H, L and M, for high, low and medium
power dissipation regions.
- Detecting Recurrent Phase Behavior
under System Variability: One of the primary challenges
of phase analysis on real systems is identifying repetitive phase
patterns under system variability effects that cause changes in
both the observed metrics and the temporal behavior of each phase.
To extract existing recurrence information despite these effects,
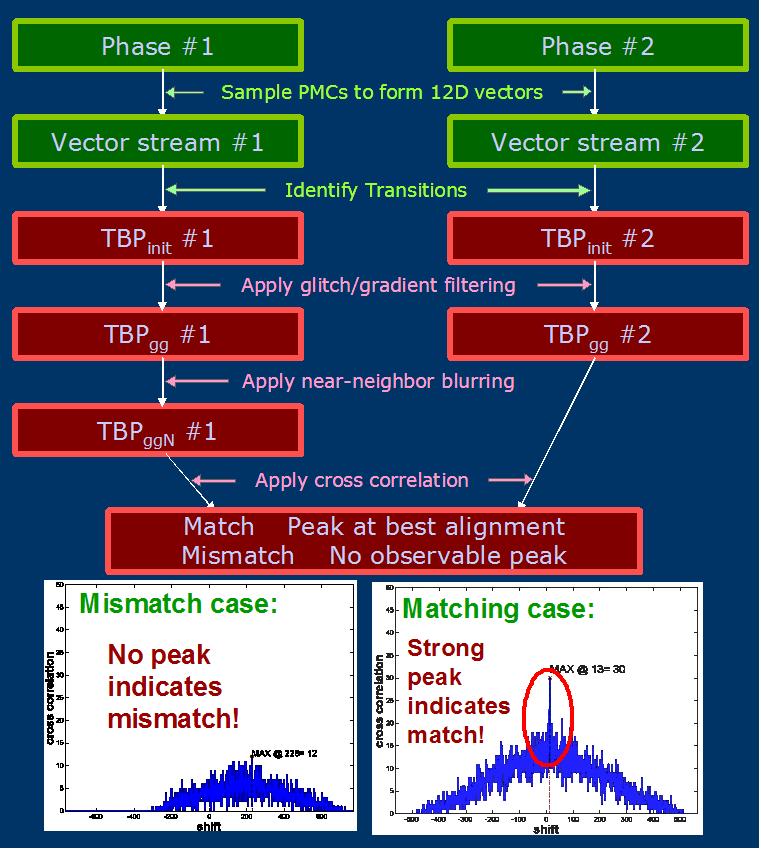
we proposed a "transition-guided"
phase detection framework that relies on phase change information
to identify repetitive execution. We introduced novel techniques
such as “glitch-gradient filtering”
and “near-neighbor blurring”
to mitigate sampling and variability effects on reflected application
phase behavior. This complete detection scheme achieved 2-8X better
detection capabilities with respect to value-based phase characterizations,
successfully identifying repetitive phase signatures with less
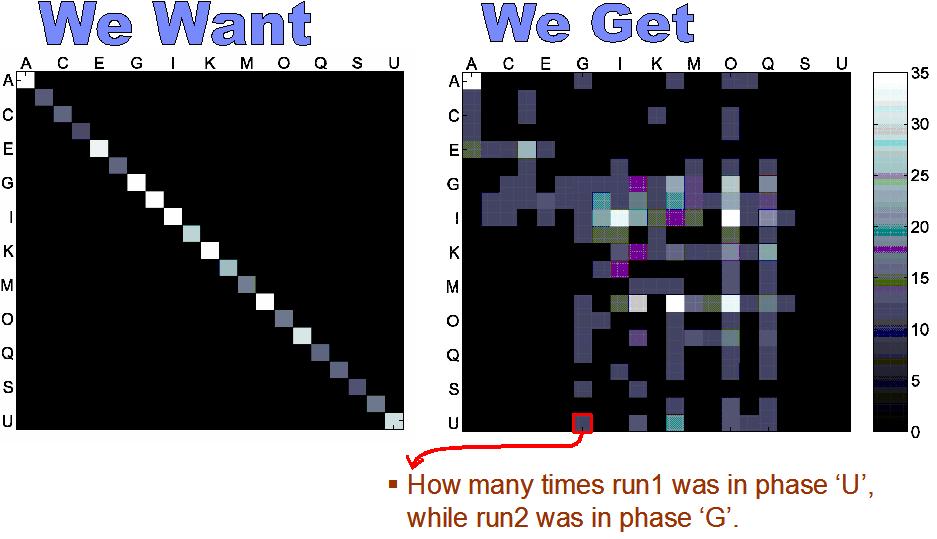
than 5% false alarms. Below I show some of the interesting observations
we had in this research and the outcomes of our detection framework.[2004][IISWC'05]
Below plot shows the mutual histograms of the observed phases
for the two runs of the same gcc
execution. Left-hand side shows the ideal results--as we see
in a simulation environment-- where the observed phases are
in perfect agreement. Right-hand result shows the actual observed
phases in our real-system experiments, where there is generally
a high disagreement in the observed phase patterns. This kind
of clarifies the challenge, although we execute the same code,
the high-level behavior shows some variation and the observed
phases are far from identical. A real phase detection implementation
should be able to discern phase patterns besides this variability.
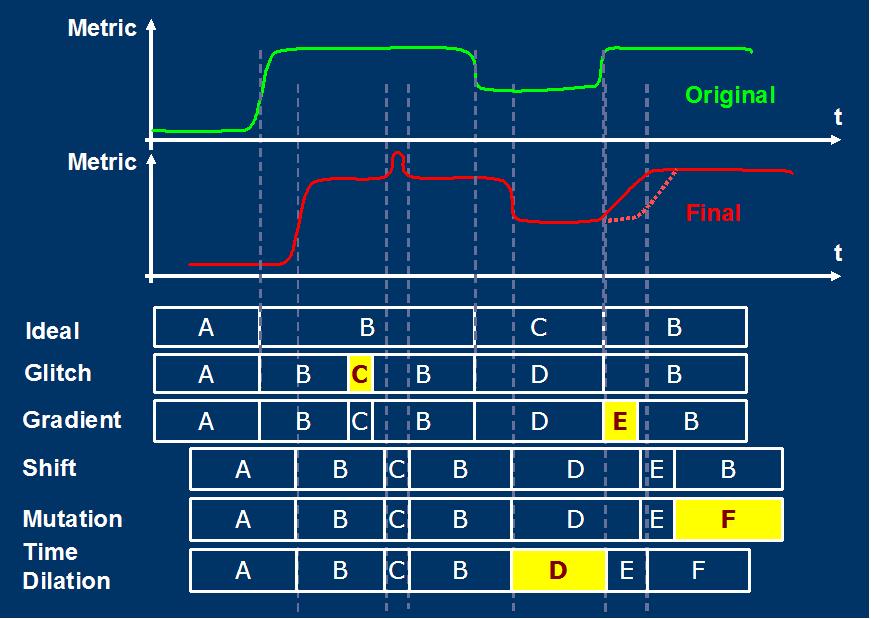
Below drawing shows our derived taxonomy for the underlying
variation effects. The green curve shows the original behavior
and the red curve shows the new observed behavior under these
variations:
Below flowchart shows our transition-guided framework for detecting
recurrent application behavior under such variability, with examples
to matching and mismatch cases:
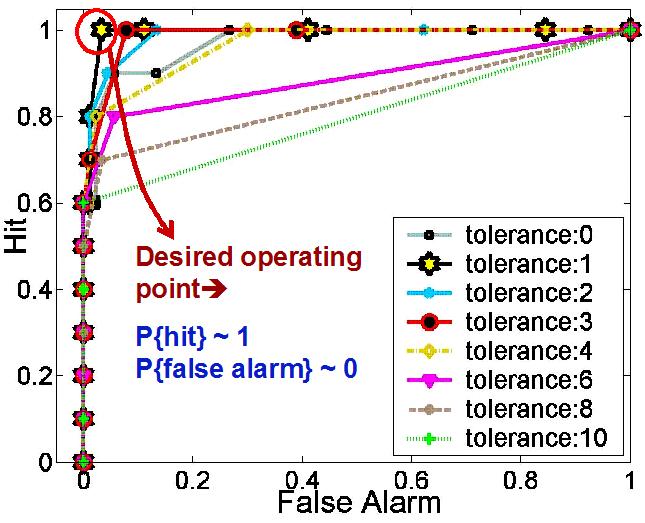
Finally, this last plot shows the observed Receiver Operating
Characteristic (ROC) curves for our repetitive phase detection
study, for the whole set of applications and for a range different
tolerances in our near-neighbor blurring method. In these results
we see that our transition guided phase detection can achieve
100% detection with less than 5% false alarms for a unified detection
threshold, with a tolerance of 1 sample:
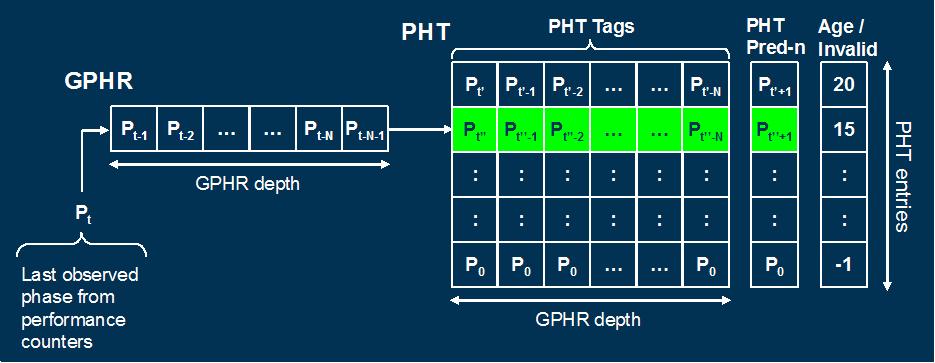
- Runtime Phase Prediction with
the Global Phase History Table (GPHT) Predictor:
In this part of our phase analysis research, we have considered
new methods for projecting future application phase behavior in
real-system experiments. Specifically, we proposed a Global
Phase History Table (GPHT) predictor that is inspired
from an architectural technique, namely global branch
history predictor, but implemented in the operating system for
runtime phase predictions on real systems. This GPHT predictor
is configured at runtime. Afterwards, it seamlessly monitors and
accurately predicts varying workload behavior with no visible
interference to native system operation. Compared to existing
reactive and statistical approaches. the GPHT predictor significantly
improves the accuracy of the predicted behavior, reducing the
misprediction rates by 2.4X for applications with varying behavior.
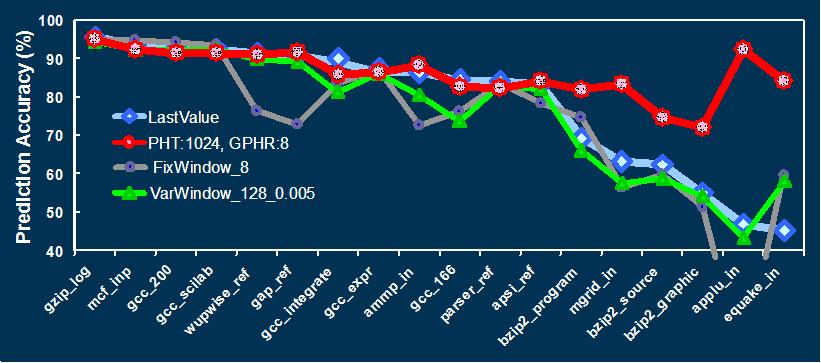
Below I show the GPHT predictor implementation and the phase prediction
accuracies with GPHT (red) and some other prediction approaches.
[2006][MICRO-39#1]
3. Workload/Phase
Adaptive Dynamic Power Management [2004-2007]
There are two main enablers for dynamic power management (DPM)
techniques that aim to tune system operation to the workload demands.
First, there exists a wide disparity in power/performance characteristics
among different workloads. This “spatial” or
“inter-workload” variability can enable different
optimal responses for different applications. Second, applications
also exhibit highly variable (and often repetitive) behavior within
themselves at different execution regions. This “temporal”
or “intra-workload” form of variability—
which is commonly referred to as “phase behavior”—also
enables different dynamic optimizations. This part of our research
focuses on novel predictive strategies that leverage these two forms
of variability to efficiently guide workload-adaptive, dynamic management
techniques at different levels of abstractions from architectures
to data centers.
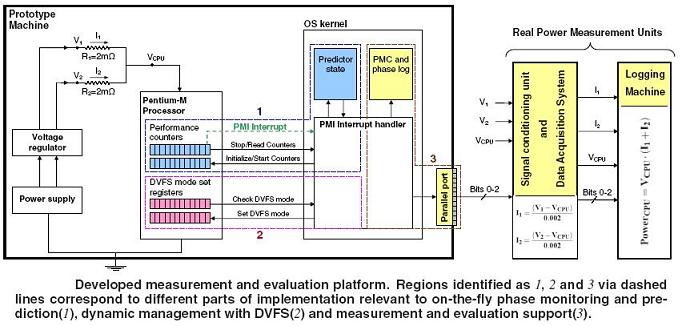
- Phase-Driven Dynamic Power Management
on Real Systems: In this study, we have demonstrated
an immediate application of GPHT-based runtime phase predictions
to guide dynamic power management. I have defined and used simple
phase classifications that reflect the dynamic voltage and frequency
scaling (DVFS) potentials of different execution regions. I have
developed a complete real system prototype implementation that
autonomously predicts future DVFS potentials of running applications
and adapts processor settings accordingly on the fly with no visible
overheads. This experiment showed that such phase-driven dynamic
adaptations can improve power-performance efficiency of the processor
by 27% on average. Moreover, this system-level management technique
can be dynamically reconfigured at runtime for varying power-performance
targets without necessitating any hardware support. [2006][MICRO-39#1]
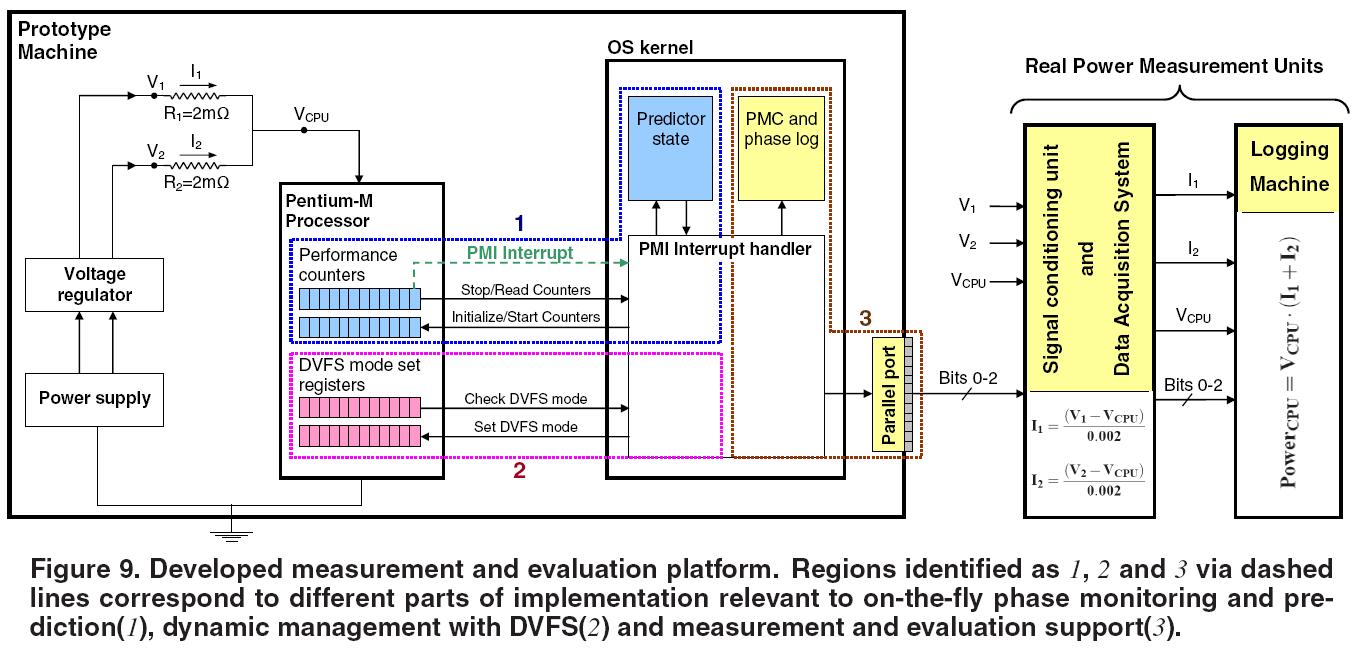
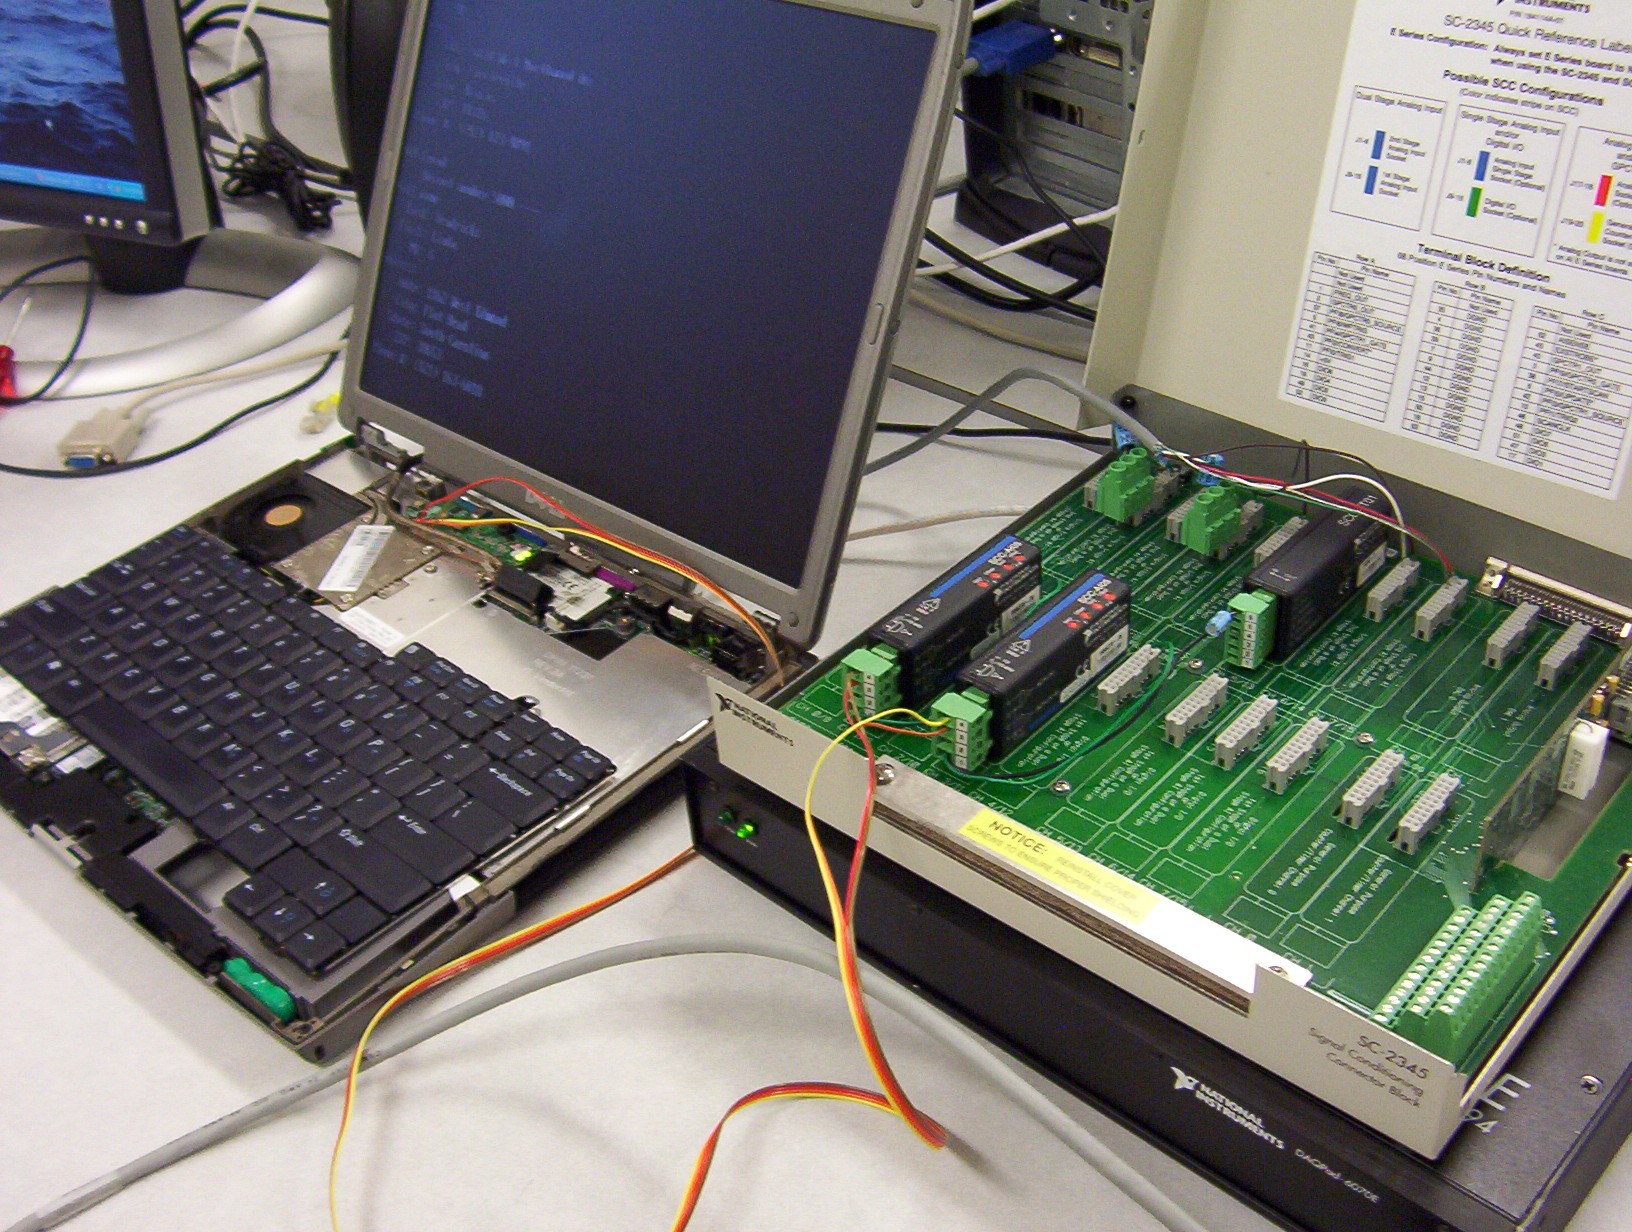
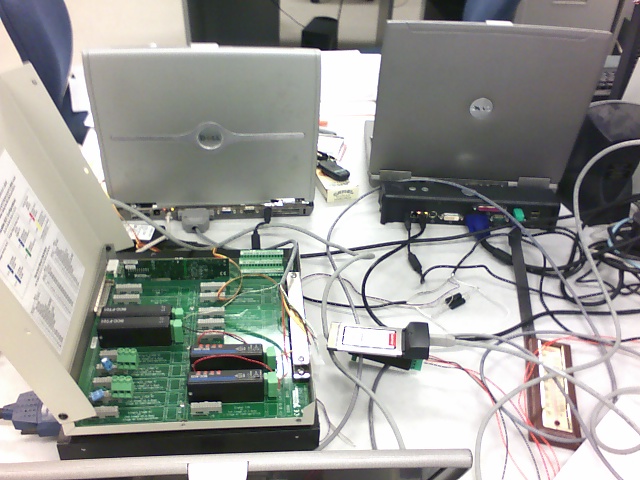
Below pictures show our new experimental setup, with a Pentium
M based test machine and a National Instruments Data Acquisition
pad (DAQpad). (Click on the images to enlarge). Afterwards the
schematic shows the overview of the experimental setup.
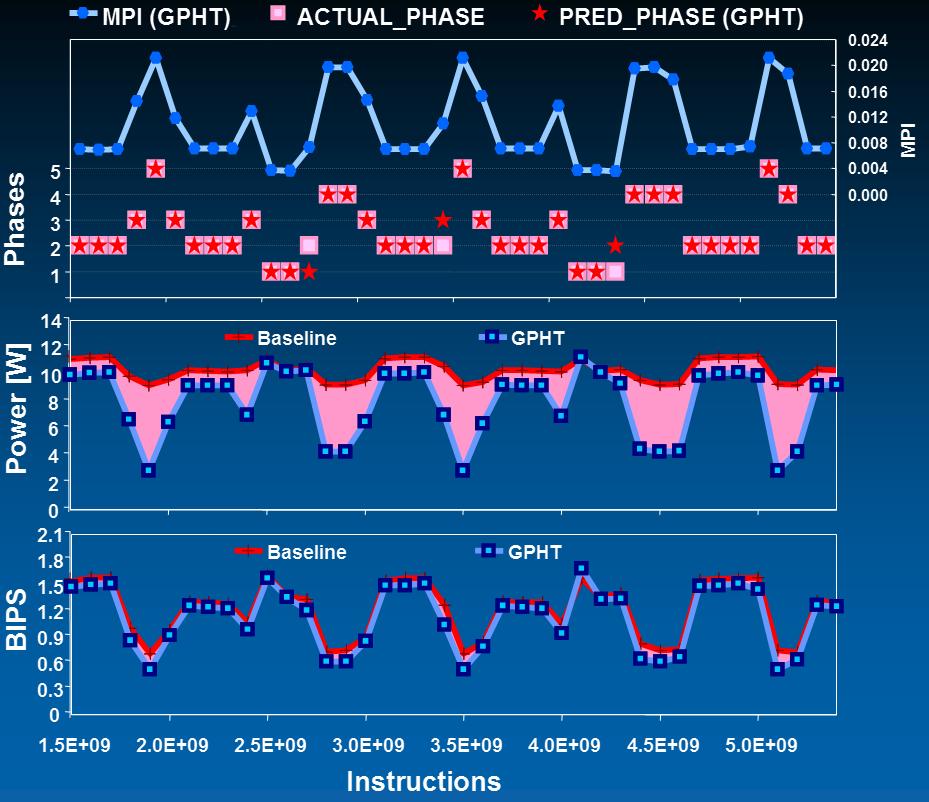
Below figure is an example set of results with the applu
benchmark. Top chart shows the actual and predicted phases,
middle chart shows the power savings with phase-driven power
management and bottom chart shows the small performance degradation:
- Global Power Management in Chip
Multiprocessors: Chip multiprocessors (CMPs) are
becoming the main architectural norm and the current trend is
towards integrating more cores per chip. With this new, exciting
direction comes many interesting challenges about how we can manage
these pools of processing units in a chip. Moreover, while chip
power envelopes are defined for worst case, the gap between average
behavior and worst case widens with increasing cores per chip
and application variability. Following from these observations,
We have investigated the trade-offs among different power management
strategies for CMPs under varying power budgets. We have worked
on this project during one of my internship at IBM TJ Watson research
and afterwards, so this is joint work with Alper
Buyuktosunoglu, Pradip
Bose and Chen-Yong
Cher. We proposed a hierarchical CMP management framework
at the architecture level with (i) global monitoring and control
that is exposed to the activities of all chip components and decides
upon per-core actions based on global objectives; and (ii) local
monitoring and control on each core that performs open-loop per-core
management actions and reports core power/performance information
to the global control. This architectural study showed that dynamic
per-core management with the global controller can efficiently
leverage both inter- and intra-workload variability to significantly
improve CMP power-performance efficiency under reduced power budgets.
To perform such dynamic management at runtime, I have also devised
predictive methods
to estimate the power performance of CMP systems across different
power modes. This study showed that global DPM policies can perform
within 1% power-performance efficiency of an oracular management
with such predictive power mode selections. Compared to chip-wide
and static management strategies, this per-core management approach
achieved 5X and 2X improvements in the global chip-level power-performance
efficiency, providing consistent responses with varying power
budgets and application characteristics.[2005][MICRO-39#2]
Below sketch shows our envisioned hierarchical management strategy.
In this work, we focused on the global management aspect of
it:

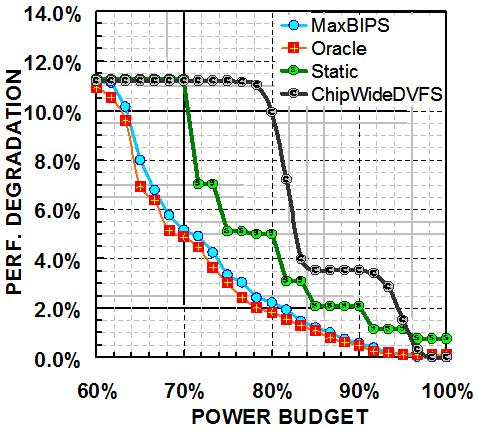
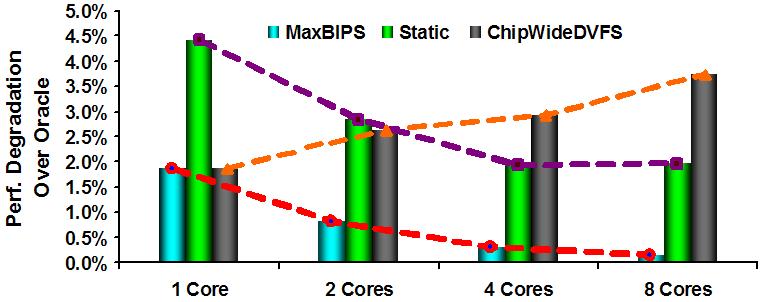
Below plots are two examples to our management strategy. Left-hand
plot shows the observed performance degradations at different
power budgets for dynamic management (MaxBIPS), and other possible
approaches, namely distributed static and chip-wide dynamic
management for a 4-core CMP processor. Right hand shows the
trends with different management approaches as we scale-out
into more cores/chip:
- Power-Efficient Resource Management
in Heterogeneous Data Centers: In recent years
it has been widely recognized that power consumption is a primary
issue also in the data centers due to the associated power delivery
and cooling costs. Here, We have looked at the applications of
DPM strategies at the data center level. This work is done during
my internship at Intel Hillsboro/ CTG/ STL/ PCL, and is joint
work with Eugene
Gorbatov and Ripal
Nathuji. The primary driver for this work is that there exists
significant platform heterogeneity across data centers due to
generational upgrade cycles. This heterogeneity is reflected in
different orthogonal dimensions such as microarchitecture, memory
subsystem and power supply variations. We demonstrated that significant
power savings can be achieved by allocating workloads to these
heterogeneous platforms in a power-aware manner. This work proposed
a power-efficient resource allocation framework guided by an “across-platform
workload behavior predictor”. This predictor utilizes
architectural application features to project workload behavior
on platforms with different architectural and memory system properties.
Experiments based on real measurements showed that such power-efficient
resource allocation based on across-platform predictions can perform
within 2% of an oracular allocator and improves total data center
power consumption by 21%.[2006][ICAC-4]
4. Current
Work [2007-Onwards]
Right now I have couple projects in the pipeline about considering
thermal management with the GPHT environment and going into multithreaded/parallel
application management in global CMP power management and considering
multiple contexts for phase prediction. Most of my time went to
preparing papers and talks since Sep 2006, coming back from Intel
(Two Micro talks, one SRC Symp. talk, the pre-defense and first
job talk, etc.); and now I am starting my job search. So I can't
get much time to progress on those these days. Hopefully i will
get some time to work on these in the near future and have more
in here eventually.
(Older multipage version of research page is here.)
|